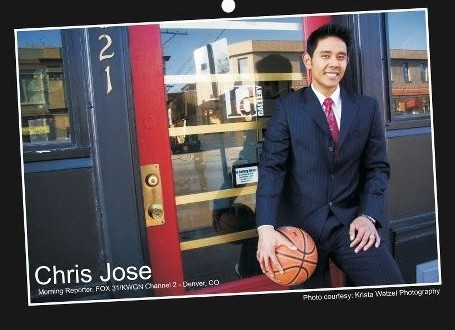
Two years ago, AAJA members could keep track of their schedules with a different male Asian American journalist smiling at them each month.
The calendar was created to fund programs that increase diversity in the television news industry, because Asian Americans — men in particular — are “not visible in television news,” said Randall Yip, one of the calendar models.
These days, the calendar men say that diversity and opportunities have improved for Asian American men in the industry, but that many obstacles still exist, such as family pressure, low salaries and a lack of role models.
About one third of the men have moved to larger, more visible markets or positions.
Howard Chen, who landed his “dream job” of reporting for Comcast SportsNet in his hometown of Houston, attributes part of his success directly to the calendar.
“I had a [job] interview with the general manager of my current station, Comcast SportsNet,” Chen said. “I decided to bring the calendar in; he was a little bit surprised, but it definitely helped break the ice. That interview was my best meeting ever with a prospective employer. Now I’m living my dream, covering the teams I grew up wanting to cover. I’m at a place where I can do in-depth stories and not worry about time.”
Chen’s success goes along exactly with why the calendar was created: to improve opportunities for Asian American men in broadcasting, according to George Kiriyama, who was the cover model and top vote-getter. (The men who were featured in the calendar got there by popular vote, with each vote costing $1.)
“We definitely have more men now than 10 years ago,” Kiriyama said. “But there are [still] more women in the business than men.”
Archith Seshadri, a reporter for Fox 46 in Charlotte, N.C., was working in the smaller market of Augusta, Ga., when the calendar came out. He agreed that the broadcast industry needs lots more male Asian Americans.
“I can literally count the number of reporters/anchors because we have so few in the industry,” he said.
A Voices analysis of the genders and ethnicities of on-air talent at the 40 broadcast stations in the top 10 television markets showed that 31 stations do not have any male Asian American on-air talent. Out of the 98 total Asian American on-air talent in those markets, only 22 percent are men.
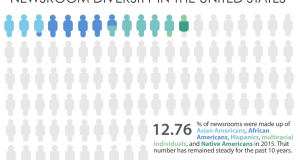
The data also revealed that Asian Americans as a whole are underrepresented in the broadcast industry. Out of the 40 stations, 25 have a smaller percentage of Asian American on-air talent than they have Asian Americans in their market, according to 2010 figures from the U.S. Census. The stations had an average of 64.3 percent whites, 16.5 percent blacks, 8.6 percent Latinos and 7.3 percent Asian Americans.
Shawn Chitnis, a CBS reporter in Spokane, Wash., who has shifted from weekend to weekday news since the calendar’s release, said it is important for stations to provide viewers with the insight that comes from a diverse team of journalists.
“I think that any time you have a group that is underrepresented in the media, organizations and their audiences miss out on a perspective that adds to the coverage of a variety of issues,” Chitnis said.
Randall Yip, senior producer at KGO-TV in San Francisco, said television news cannot “pretend to provide coverage of the communities it serves when it ignores roughly 50 percent of the Asian American population.”
“This lack of visibility translates into the poor self-image of Asian American men and affects the ways others outside the Asian American community see us,” Yip added.
One reason there are so few Asian American men in broadcast is a lack of role models, Kiriyama said.
“A lot of Asian American women saw people like Connie Chung and Juju Chang growing up,” he said. “When you see someone who’s in the business, you feel that you can do it, too. There’s a lack of [male] role models.”
Chen said serving as a positive influence for aspiring reporters was an important reason he went into broadcasting.
“I chose TV because I figured it was more influential for people to see my face on a TV screen, as opposed to hearing my voice on the radio or seeing my name in print,” Chen said. “You’re able to influence more people, to pay it forward so others can be inspired to think about the possibilities in their lives.”
Aside from a lack of role models, family pressures and gender stereotypes are key factors that keep Asian American men from going into broadcast, Kiriyama said.
“A lot of families put pressure on their sons to go into the stereotypical Asian American jobs: doctor, dentist, engineer,” he said. “[There’s] pressure to be the breadwinner. The salary that everyone earns at the beginning of their careers discourages a lot of Asian American men. It’s not a very lucrative career when you begin.”
Chen said he thinks that as more Asian American men start to do things “outside the box,” they will have an easier time being accepted by their families.
“There’s something to be said for being happy when you go to work,” he said. “If more parents encouraged their kids to go after their dreams, more [opportunities] would open up.”
Ultimately, Chen said, the only way to improve male Asian American representation in broadcasting is through hard work.
“It’s a tough journey for all of us, whether you’re Asian or not,” he said. “But if you persevere and you want to get better, down the road things will work out. It doesn’t apply just to Asian men, but to anyone who wants to follow their dream.”
Follow @AimeeCho17 on Twitter.
The following database was compiled from news station staff pages as of July 2014 and 2010 Census figures.
| City | Station | Asian men | Asian men percentage | Asian total | Asian percentage | Asian census | Census to TV difference |
|---|---|---|---|---|---|---|---|
| New York | WNBC | 0 | 0.00% | 2 | 5.13% | 12.70% | -7.57% |
| New York | WABC | 0 | 0.00% | 4 | 9.52% | 12.70% | -3.18% |
| New York | WCBS | 0 | 0.00% | 2 | 5.88% | 12.70% | -6.82% |
| New York | WNYW | 1 | 3.70% | 3 | 11.11% | 12.70% | -1.59% |
| Los Angeles | KNBC | 4 | 11.76% | 6 | 17.65% | 11.30% | 6.35% |
| Los Angeles | KABC | 2 | 4.88% | 4 | 9.76% | 11.30% | -1.54% |
| Los Angeles | KCBS | 0 | 0.00% | 4 | 11.76% | 11.30% | 0.46% |
| Los Angeles | KTTV | 0 | 0.00% | 4 | 13.33% | 11.30% | 2.03% |
| Chicago | WMAQ | 0 | 0.00% | 1 | 3.13% | 5.50% | -2.38% |
| Chicago | WLS | 1 | 2.56% | 3 | 7.69% | 5.50% | 2.19% |
| Chicago | WBBS | 0 | 0.00% | 2 | 6.67% | 5.50% | 1.17% |
| Chicago | WFLD | 0 | 0.00% | 1 | 4.00% | 5.50% | -1.50% |
| Philadelphia | WCAU | 0 | 0.00% | 1 | 3.13% | 6.30% | -3.18% |
| Philadelphia | WPVI | 0 | 0.00% | 2 | 5.56% | 6.30% | -0.74% |
| Philadelphia | KYW | 0 | 0.00% | 2 | 6.90% | 6.30% | 0.60% |
| Philadelphia | WTXF | 0 | 0.00% | 1 | 4.17% | 6.30% | -2.13% |
| Dallas | KXAS | 0 | 0.00% | 1 | 2.63% | 2.90% | -0.27% |
| Dallas | WFAA | 0 | 0.00% | 0 | 0.00% | 2.90% | -2.90% |
| Dallas | KTVT | 0 | 0.00% | 1 | 3.03% | 2.90% | 0.13% |
| Dallas | KDFW | 0 | 0.00% | 0 | 0.00% | 2.90% | -2.90% |
| San Francisco | KNTV | 3 | 9.09% | 7 | 21.21% | 33.30% | -12.09% |
| San Francisco | KGO | 3 | 10.71% | 8 | 28.57% | 33.30% | -4.73% |
| San Francisco | KPIX | 3 | 7.32% | 9 | 21.95% | 33.30% | -11.35% |
| San Francisco | KTVU | 4 | 10.53% | 7 | 18.42% | 33.30% | -14.88% |
| Boston | WHDH | 0 | 0.00% | 3 | 10.00% | 8.90% | 1.10% |
| Boston | WCVB | 0 | 0.00% | 2 | 6.06% | 8.90% | -2.84% |
| Boston | WBZ | 0 | 0.00% | 1 | 3.23% | 8.90% | -5.67% |
| Boston | WFXT | 0 | 0.00% | 0 | 0.00% | 8.90% | -8.90% |
| Atlanta | WXIA | 0 | 0.00% | 0 | 0.00% | 3.10% | -3.10% |
| Atlanta | WSB | 0 | 0.00% | 1 | 2.13% | 3.10% | -0.97% |
| Atlanta | WGCL | 0 | 0.00% | 1 | 3.70% | 3.10% | 0.60% |
| Atlanta | WAGA | 0 | 0.00% | 1 | 2.78% | 3.10% | -0.32% |
| DC | WRC | 0 | 0.00% | 2 | 4.76% | 3.90% | 0.86% |
| DC | WJLA | 1 | 2.13% | 2 | 4.26% | 3.90% | 0.36% |
| DC | WUSA | 0 | 0.00% | 2 | 9.52% | 3.90% | 5.62% |
| DC | WTTG | 0 | 0.00% | 2 | 6.06% | 3.90% | 2.16% |
| Houston | KPRC | 0 | 0.00% | 0 | 0.00% | 6.00% | -6.00% |
| Houston | KTRK | 0 | 0.00% | 2 | 6.25% | 6.00% | 0.25% |
| Houston | KHOU | 0 | 0.00% | 4 | 10.81% | 6.00% | 4.81% |
| Houston | KRIV | 0 | 0.00% | 0 | 0.00% | 6.00% | -6.00% |
 VOICES Publishing from the AAJA National Convention

