Newspaper, magazine, broadcast — it’s not a secret that these traditional ways of storytelling are shifting and changing with the times.
No longer is it sufficient for journalists to be generally asking, “How can I tell the story better?”
Today, a new, more specific question needs to be asked: “How can I better tell the story with the skills that I have?”
For Huffington Post visual journalist Hilary Fung, answering that question means figuring out how to create and connect visuals with written stories. She says that by incorporating visuals in her storytelling, readers are able to better understand and relate to stories that are more data-heavy.
“When I was at Medill, I was interested in graphic design, so I did some graphic design work for nonprofits,” she says. “At the same time, I was taking journalism classes. … I realized I could combine design and journalism [and] I started doing more web design.”
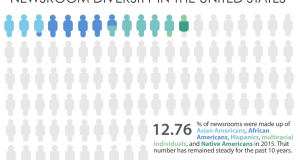
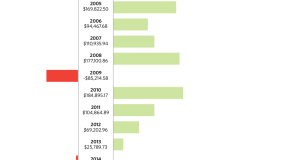
At the Huffington Post, Fung works in a four-person data team that makes interactive designs to help organize statistics and numbers creatively. These designs include maps, graphics, bar charts and scatter plots.
“This allows you to cover trends or outliers in things that you wouldn’t be able to find otherwise,” Fung says. “It’s also a good way of summarizing a situation … [and] a good way of explaining things.”
Her team recently created a World Cup dashboard, which gave readers in-depth illustrative updates, including summaries of matches, schedules for upcoming brackets, and play-by-plays of each match and each shot.
To Martin Gee, Time’s senior art director, illustrations and designs capture the attentions of consumers in today’s predominantly visual culture.
“If you throw down, say, 5,000 words about something, it’s going to be harder to digest as opposed to something with graphics, photos [and] good typography,” Gee says. “It makes it more reader friendly.”
Whether it be typography, photography or videography, Fung encourages journalists to be creative with their storytelling. “Whatever it is, it can be used in journalism.”
Fung will be presenting twice at AAJA’s National Convention. On Thursday, she will give a talk alongside Katie Park, a graphics editor for The Washington Post, about the do’s and don’ts of charts and data visualization. On Friday, she will speak on a panel moderated by Tim Wong, also from The Washington Post, about shaping stories for different platforms.
 VOICES Publishing from the AAJA National Convention


