 VOICES Publishing from the AAJA National Convention
Thanks to a new bill proposed by Congress, Asian students may no longer be checking a one-size-fits-all “Asian” box when they provide information about themselves for school. Instead, they will be able to select from 11 specific Asian ethnicities, such as Chinese, Japanese or Korean.
The All Students Count Act, introduced by Rep. Mike Honda (D-Calif.) on July 31, targets the “erroneous and dangerous” blanket assumption — also known as the model minority myth — that all Asian American and Pacific Islander (AAPI) students perform well in education, Honda said.
“For too long, we have been fighting the model minority myth. To really address educational inequity, we need to know how each group is doing. Our Japanese American students have a different experience than our Indian American, Hmong American, Filipino American and other AAPI students,” he said.
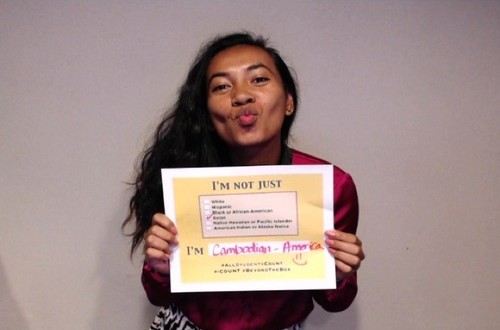
An #AllStudentsCount movement has popped up on social media and a Tumblr page, with people tweeting and Instagramming selfies that feature signs saying, “I’m not just Asian, I’m [insert ethnicity here].”
Currently, state education departments are required only to report data such as graduation rates and test scores broken down by general race categories: white, black, Hispanic and Asian. The All Students Count Act would require states to report the Asian students’ data broken down, or disaggregated, by the same categories used in the U.S. Census: Asian Indian, Chinese, Filipino, Japanese, Korean, Vietnamese, other Asian, Native Hawaiian, Guamanian or Chamorro, Samoan and other Pacific Islander, according to the Southeast Asia Resource Action Center (SEARAC).
In 2013, California State University in Sacramento began taking steps to disaggregate data after administrators learned that Hmong American students, the second largest Asian American subgroup on campus, were being underserved. Disaggregating the data allowed them to stop being lumped into an “Other Asian” category, according to SEARAC.
Quyen Dinh, executive director of SEARAC, said that the needs of Southeast Asian American students who come from recent refugee and immigrant families are especially affected by being lumped into the general Asian category. She said that 86 percent of all Asian Americans age 25 and older hold a high school degree, but that only 65 percent of Hmong Americans and 67 percent of Cambodian Americans do.
“Disaggregated data is essential so that we can provide targeted resources to prevent these alarming dropout rates from growing,” she said.
Many school districts already collect the disaggregated data, so complying with the bill should be easy, according to Lara Kaufmann, senior counsel and director of education policy for at-risk students for the National Women’s Law Center.
“They already have computer systems that would make it easy for them to disaggregate and tabulate with the push of a button,” Kaufmann said. “It’s just that school districts tend to be resistant about more data reporting requirements. The more categories you list, the more they’re likely to push back, [but] sunshine is the best disinfectant. The more data that’s out there, the better.”
Kaufmann said she thinks the likelihood of the bill passing in the near future is small.
“Typically these sorts of bills get folded into larger education bills, and big education bills tend to be controversial and hard to pass. Right now, with the political climate the way it is, it’s very hard for Congress to pass anything,” she said. “So it’s unlikely that the current Congress will pass it, but that doesn’t mean it’s not important to introduce it. When the time does come, people will be educated and contact their Congress members about it.”
Robert Teranishi, principal investigator for the National Commission on Asian-American and Pacific Islander Research in Education, described data disaggregation as “one of the most important civil rights issues for the AAPI community.”
“Without disaggregated data, AAPI students will continue to be overlooked, underserved, and largely absent from policy debates that are important to the community,” Teranishi said.
He added that education is not the only issue for which data disaggregation is necessary.
“Disaggregated data is especially important for our most vulnerable AAPI subgroups. These populations face barriers and challenges … with poverty, employment, health, housing and other aspects of their lives,” he said.
Honda agreed that the need for stronger data “goes beyond education.”
“Socioeconomic diversity, linguistic isolation, labor force — these are only a few areas where robust data collection will lend a sharper image of the American landscape,” Honda said.
Honda said he thinks the All Students Count Act will have a “far-reaching” impact once it is passed.
“This issue is a key priority not just for AAPIs; it is a priority for the entire country,” he said. “We must look past the assumption we hold, dig deeper for better data that better represents our reality, and act quickly on that data to correct any disparities. The health of our nation’s economy and society depends on this.”
Follow @AimeeCho17 on Twitter.
| Population | Living in poverty | Unemployed | No HS degree | Only HS degree | Some college | Bachelor’s degree | Graduate degree | |
|---|---|---|---|---|---|---|---|---|
| US | 307 million | 13.2% | 4.2% | 15.0% | 28.5% | 28.8% | 17.5% | 10.2% |
| All Asians | 15.5 million | 11.8% | 3.5% | 14.4% | 16.3% | 20.5% | 29.3% | 19.5% |
| Indian | 3.05 million | 8.1% | 4.4% | 8.2% | 8.8% | 10.7% | 32.5% | 39.7% |
| Bangladeshi | 146,612 | 27.9% | 5.0% | 19.2% | 18.1% | 18.0% | 23.4% | 21.3% |
| Cambodian | 256,956 | 20.8% | 6.8% | 35.2% | 23.3% | 24.1% | 13.1% | 4.2% |
| Chinese | 3.66 million | 15.4% | 3.9% | 18.4% | 14.3% | 14.7% | 25.5% | 27.1% |
| Filipino | 2.66 million | 7.1% | 5.3% | 7.6% | 15.2% | 29.2% | 39.2% | 8.8% |
| Hmong | 265,415 | 27.4% | 7.3% | 32.1% | 24.5% | 28.4% | 11.0% | 4.0% |
| Indonesian | 65,208 | 14.4% | 5.9% | 5.0% | 19.8% | 27.2% | 30.3% | 17.7% |
| Japanese | 780,210 | 8.5% | 2.4% | 4.8% | 19.0% | 27.2% | 31.8% | 17.2% |
| Korean | 1.45 million | 14.9% | 4.0% | 7.7% | 18.4% | 20.3% | 34.3% | 19.3% |
| Laotian | 212,340 | 20.0% | 8.0% | 30.2% | 32.2% | 25.3% | 9.4% | 3.0% |
| Pakistani | 366,407 | 16.4% | 5.3% | 12.3% | 14.4% | 19.2% | 30.3% | 23.8% |
| Thai | 182,708 | 17.0% | 4.8% | 18.2% | 17.0% | 21.7% | 26.8% | 16.3% |
| Vietnamese | 1.68 million | 15.8% | 5.1% | 29.2% | 21.6% | 23.5% | 18.7% | 7.0% |
| Polynesian | 341,077 | 22.0% | 9.0% | 12.3% | 38.6% | 34.3% | 10.1% | 4.7% |
| Hawaiian | 175,299 | 20.8% | 7.9% | 9.8% | 40.0% | 32.3% | 12.4% | 5.5% |
| Samoan | 103,079 | 21.7% | 9.7% | 13.7% | 38.1% | 37.5% | 6.7% | 4.1% |
| Micronesian | 131,289 | 24.6% | 10.0% | 18.6% | 34.0% | 35.5% | 7.5% | 4.4% |
Source: 2012 census and White House