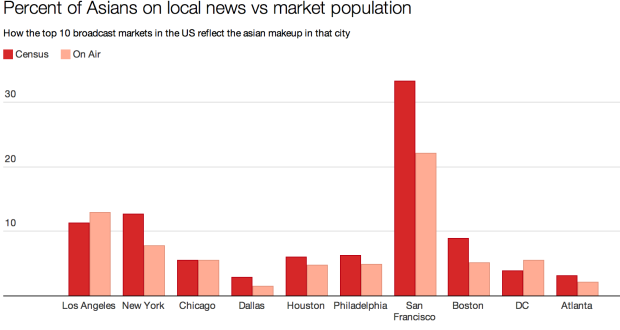
When people turn on their televisions and flip to the news, chances are good that they won’t be seeing an Asian American face. A recent survey by Hofstra University found that Asian Americans make up just 2.5 percent of the television workforce in America. And an analysis of the websites of the four major broadcast stations (NBC, ABC, CBS and Fox) in the 10 largest cities revealed that in seven of those cities, the percentage of Asian Americans on air is less than the percentage in the population. Every year, the RTDNA (Radio Television Digital News Association) and Hofstra University conduct a survey of all the television stations in the United States to determine how well-represented minorities are in the television workforce. These charts are from the 2014 survey. 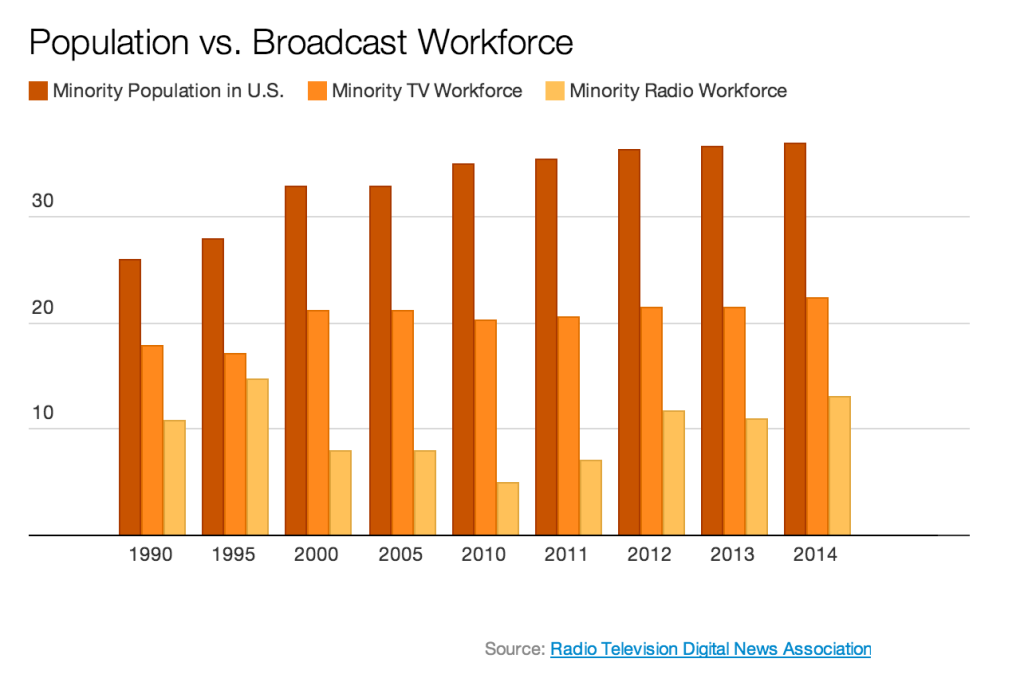
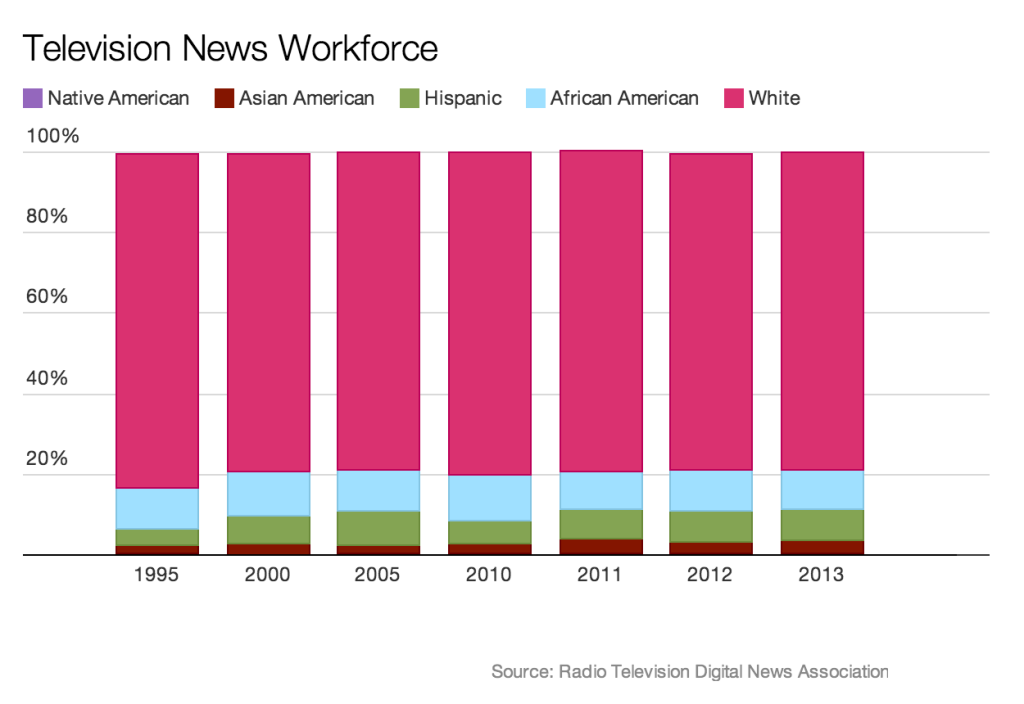 – The percentage of Asian Americans in television decreased 0.7 percent from last year. – There are more minorities in television than in radio. – In 2014, the proportion of minorities in television was 14 percent less than the proportion of minorities in the United States. – Since 1995, Asian Americans have never made up more than 3.5 percent of the television news workforce. Network This data was collected by visiting the websites of the four major broadcast networks (NBC, ABC, CBS and Fox) in each of the top 10 markets and categorizing the on-air talent by race.
 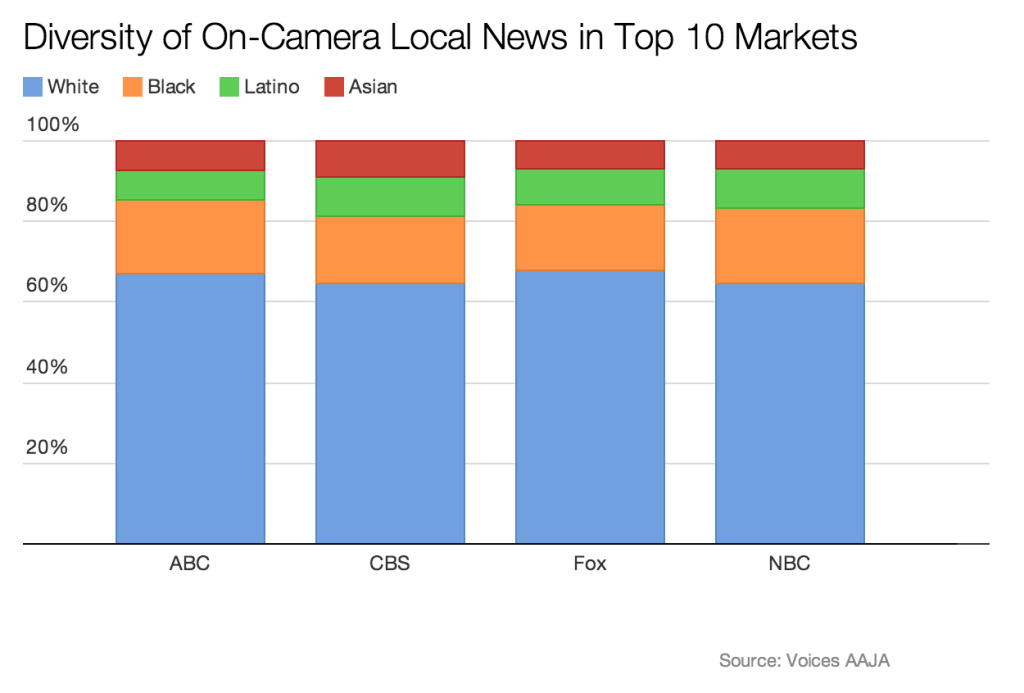 This chart focuses on the percentage of Asians in the United States as well as the percentage of Asians on-air at each of the four major networks.
 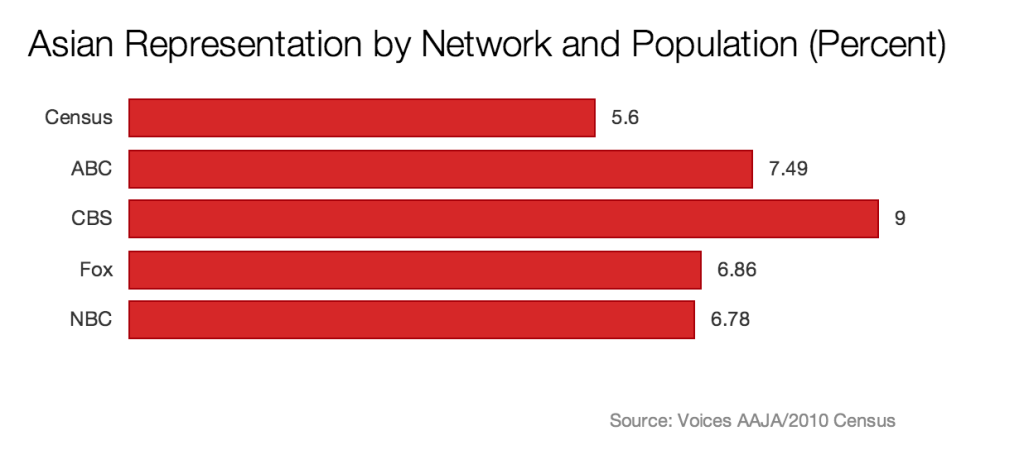 – NBC has the lowest percentage of Asians (6.78 percent) while CBS has the highest (9 percent). – Fox has the highest percentage of whites (67.87 percent). – NBC has the lowest percentage of whites (64.6 percent), but CBS comes in a close second (64.63 percent). – NBC, CBS and Fox all have less Asians than blacks or Latinos. – ABC has more Asians than Latinos, but less Asians than blacks. Market This chart was also created using the websites of the broadcast stations in the top 10 markets.
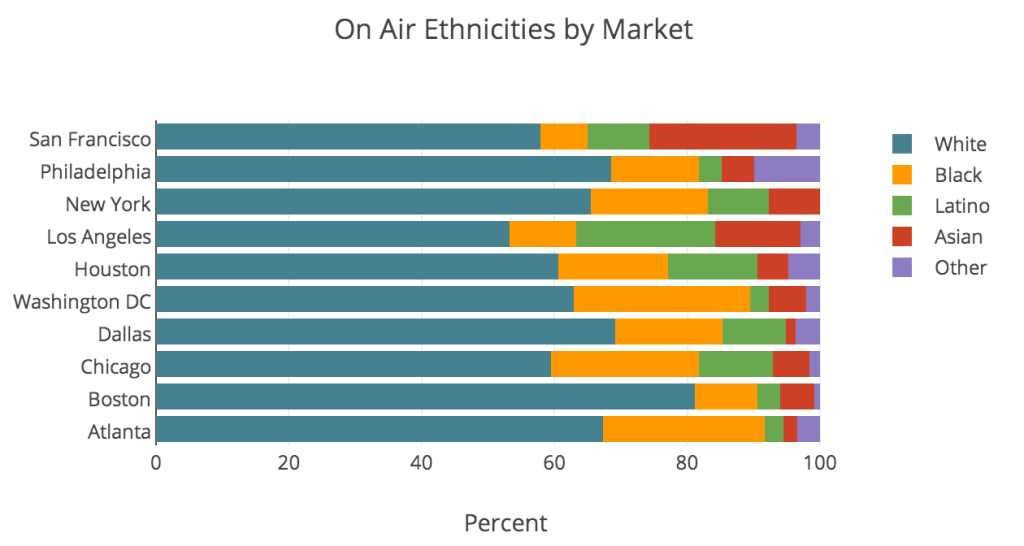
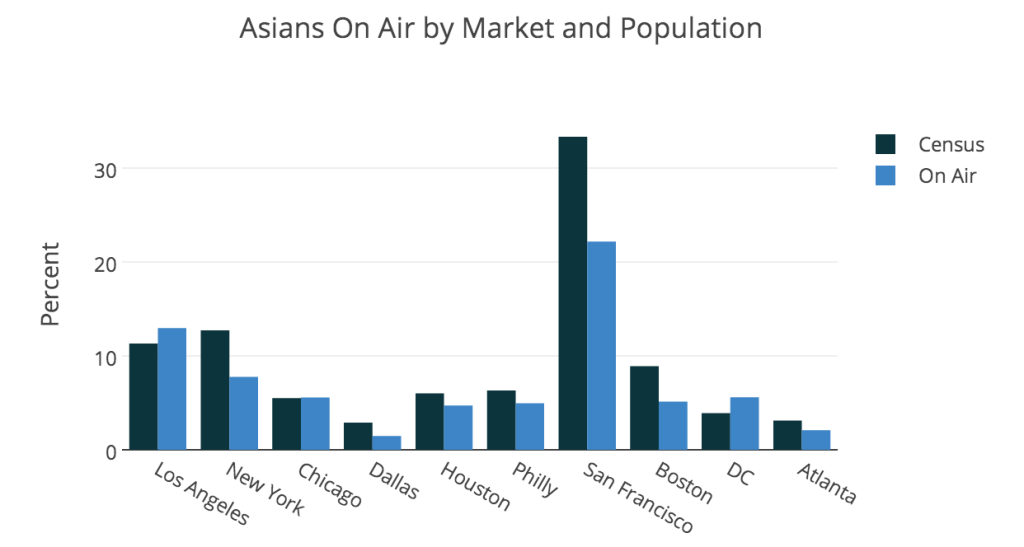
| City | Station | White men | White women | Black men | Black women | Latino men | Latino women | Asian men | Asian women | Middle Eastern men | Middle Eastern women | Other | Unidentifiable | Total New York | WNBC | 15 | 9 | 2 | 6 | 3 | 2 | 0 | 2 | 0 | 0 | 0 | 0 | 39 New York | WABC | 15 | 11 | 3 | 6 | 2 | 1 | 0 | 4 | 0 | 0 | 0 | 0 | 42 New York | WCBS | 9 | 16 | 2 | 2 | 1 | 2 | 0 | 2 | 0 | 0 | 0 | 0 | 34 New York | WNYW | 9 | 9 | 3 | 1 | 0 | 2 | 1 | 2 | 0 | 0 | 0 | 0 | 27 Los Angeles | KNBC | 13 | 4 | 1 | 2 | 3 | 5 | 4 | 2 | 0 | 0 | 0 | 0 | 34 Los Angeles | KABC | 14 | 8 | 3 | 3 | 3 | 5 | 2 | 2 | 0 | 1 | 0 | 0 | 41 Los Angeles | KCBS | 10 | 9 | 2 | 2 | 3 | 3 | 0 | 4 | 0 | 0 | 0 | 1 | 34 Los Angeles | KTTV | 9 | 7 | 1 | 0 | 3 | 4 | 0 | 4 | 0 | 2 | 0 | 0 | 30 Chicago | WMAQ | 10 | 9 | 2 | 5 | 1 | 2 | 0 | 1 | 0 | 0 | 0 | 2 | 32 Chicago | WLS | 16 | 9 | 2 | 5 | 1 | 2 | 1 | 2 | 0 | 1 | 0 | 0 | 39 Chicago | WBBS | 8 | 8 | 6 | 3 | 2 | 2 | 0 | 2 | 0 | 0 | 0 | 0 | 30 Chicago | WFLD | 12 | 3 | 1 | 4 | 0 | 4 | 0 | 1 | 0 | 0 | 0 | 0 | 25 Philadelphia | WCAU | 12 | 7 | 4 | 3 | 0 | 2 | 0 | 1 | 0 | 1 | 0 | 2 | 32 Philadelphia | WPVI | 11 | 13 | 4 | 5 | 1 | 0 | 0 | 2 | 0 | 0 | 0 | 0 | 36 Philadelphia | KYW | 7 | 15 | 3 | 1 | 1 | 0 | 0 | 2 | 0 | 0 | 0 | 0 | 29 Philadelphia | WTXF | 10 | 8 | 3 | 2 | 0 | 0 | 0 | 1 | 0 | 0 | 0 | 0 | 24 Dallas | KXAS | 17 | 10 | 4 | 3 | 1 | 2 | 0 | 1 | 0 | 0 | 0 | 0 | 38 Dallas | WFAA | 17 | 8 | 4 | 1 | 0 | 3 | 0 | 0 | 0 | 0 | 0 | 1 | 34 Dallas | KTVT | 14 | 8 | 2 | 3 | 1 | 3 | 0 | 1 | 0 | 1 | 0 | 0 | 33 Dallas | KDFW | 11 | 9 | 2 | 3 | 2 | 1 | 0 | 0 | 1 | 0 | 0 | 2 | 31 San Francisco | KNTV | 11 | 7 | 1 | 1 | 1 | 4 | 3 | 4 | 0 | 0 | 0 | 1 | 33 San Francisco | KGO | 9 | 6 | 2 | 2 | 0 | 1 | 3 | 5 | 0 | 0 | 0 | 0 | 28 San Francisco | KPIX | 16 | 9 | 1 | 1 | 2 | 3 | 3 | 6 | 0 | 0 | 0 | 0 | 41 San Francisco | KTVU | 14 | 9 | 2 | 0 | 1 | 1 | 4 | 3 | 0 | 0 | 2 | 2 | 38 Boston | WHDH | 14 | 11 | 2 | 0 | 0 | 0 | 0 | 3 | 0 | 0 | 0 | 0 | 30 Boston | WCVB | 14 | 12 | 2 | 2 | 1 | 0 | 0 | 2 | 0 | 0 | 0 | 0 | 33 Boston | WBZ | 15 | 9 | 3 | 1 | 0 | 1 | 0 | 1 | 0 | 0 | 0 | 1 | 31 Boston | WFXT | 10 | 10 | 0 | 1 | 0 | 2 | 0 | 0 | 0 | 0 | 0 | 0 | 23 Atlanta | WXIA | 16 | 9 | 3 | 5 | 0 | 0 | 0 | 0 | 0 | 0 | 0 | 1 | 34 Atlanta | WSB | 22 | 13 | 6 | 4 | 0 | 1 | 0 | 1 | 0 | 0 | 0 | 0 | 47 Atlanta | WGCL | 9 | 6 | 6 | 1 | 0 | 2 | 0 | 1 | 0 | 0 | 0 | 2 | 27 Atlanta | WAGA | 14 | 8 | 3 | 7 | 1 | 0 | 0 | 1 | 0 | 0 | 1 | 1 | 36 DC | WRC | 14 | 11 | 7 | 7 | 0 | 1 | 0 | 2 | 0 | 0 | 0 | 0 | 42 DC | WJLA | 22 | 11 | 5 | 4 | 2 | 0 | 1 | 1 | 0 | 0 | 0 | 1 | 47 DC | WUSA | 6 | 5 | 3 | 4 | 0 | 0 | 0 | 2 | 0 | 0 | 1 | 0 | 21 DC | WTTG | 11 | 10 | 4 | 4 | 0 | 1 | 0 | 2 | 0 | 0 | 0 | 1 | 33 Houston | KPRC | 13 | 7 | 3 | 3 | 4 | 2 | 0 | 0 | 0 | 0 | 0 | 2 | 34 Houston | KTRK | 13 | 7 | 2 | 3 | 3 | 1 | 0 | 2 | 0 | 0 | 0 | 1 | 32 Houston | KHOU | 16 | 6 | 3 | 3 | 2 | 2 | 0 | 4 | 0 | 0 | 0 | 1 | 37 Houston | KRIV | 10 | 5 | 2 | 2 | 0 | 3 | 0 | 0 | 0 | 0 | 0 | 2 | 24 |
|---|
 VOICES Publishing from the AAJA National Convention

